Stock Analysis Application
From Market Trends to AI-Powered Insights
Internal Project
Finance & Investments
Challenges
Modern investors need fast, interactive, and comprehensive tools to analyze stock performance, evaluate ETFs, and receive intelligent AI-based insights in real-time.
Data Overload
Processing and visualizing large volumes of stock and ETF data in real-time with technical and fundamental indicators.
Technical Complexity
Building modular, interactive components for advanced charting and multi-category financial metrics.
User Experience
Delivering a responsive and intuitive UI that supports both beginner investors and advanced traders.
AI Integration
Providing intelligent, natural-language based insights without compromising performance or reliability.
Solution
Developed a full-stack application with real-time stock and ETF tracking, rich visualizations, advanced charting tools, and AI-powered assistant for stock insights.
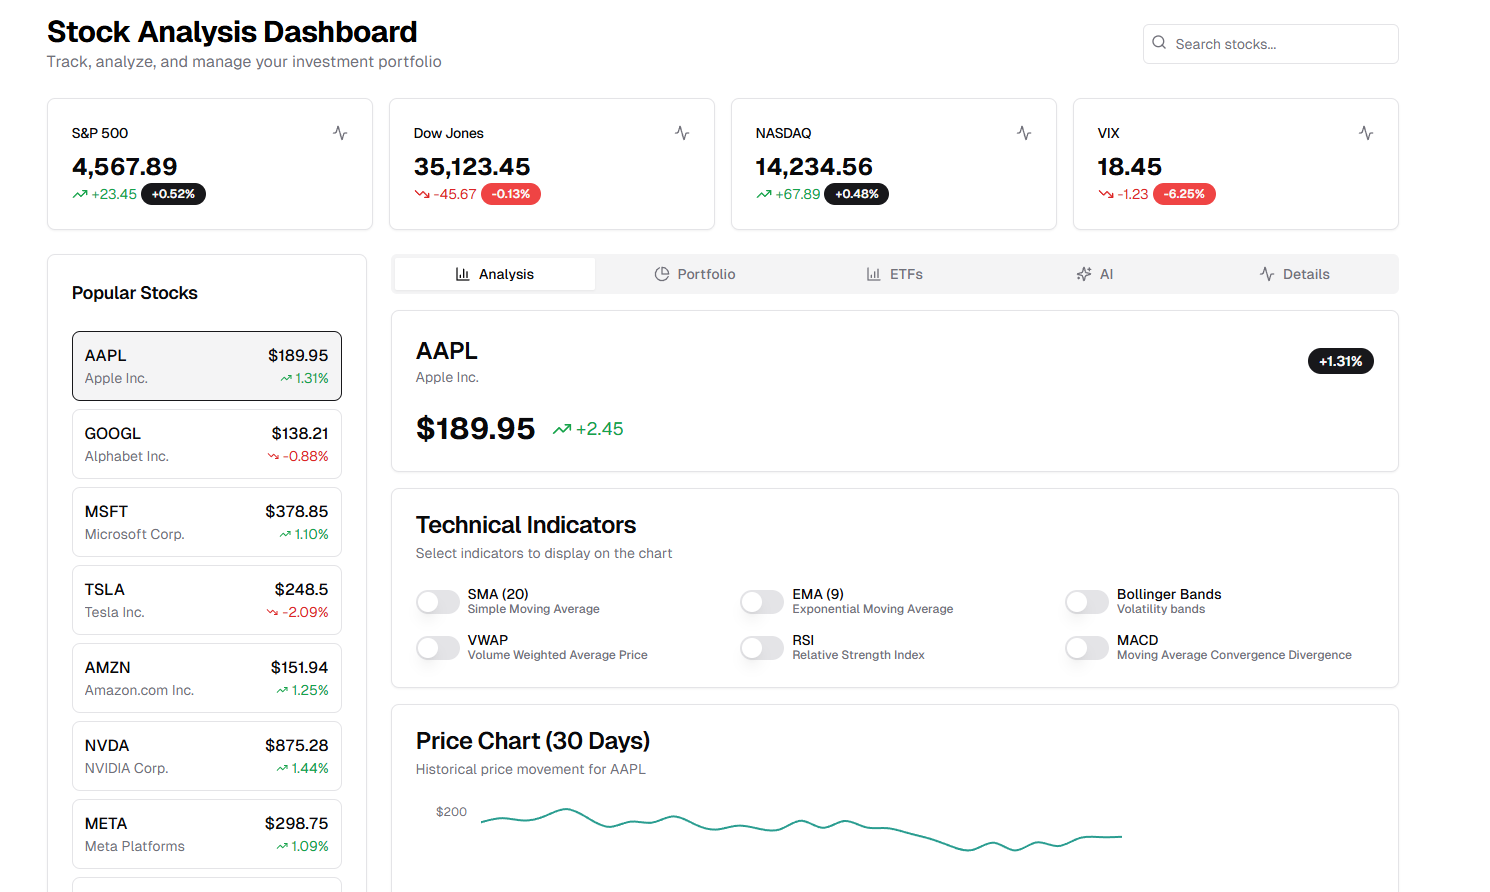
Dashboard and Market Overview
Real-time data from S&P 500, NASDAQ, VIX, and more, presented in an interactive UI.
ETF Integration
Dedicated tab with ETF holdings, sectors, trade history, and analysis tools.
Technical Indicators
Overlays for Moving Averages, RSI, MACD, Bollinger Bands, and VWAP on price charts.
AI-Powered Assistant (StockGPT)
Natural language interface for stock analysis, portfolio optimization, and sentiment evaluation using LLMs.
Detailed Fundamentals
Over 40 categorized financial metrics including valuation, profitability, growth, and liquidity ratios.
Portfolio & Watchlist Management
Track user-selected stocks and ETFs with performance summaries and recommendations.
Application Screenshots
Stock Analysis Dashboard
Main dashboard showing stock analytics and market overview.
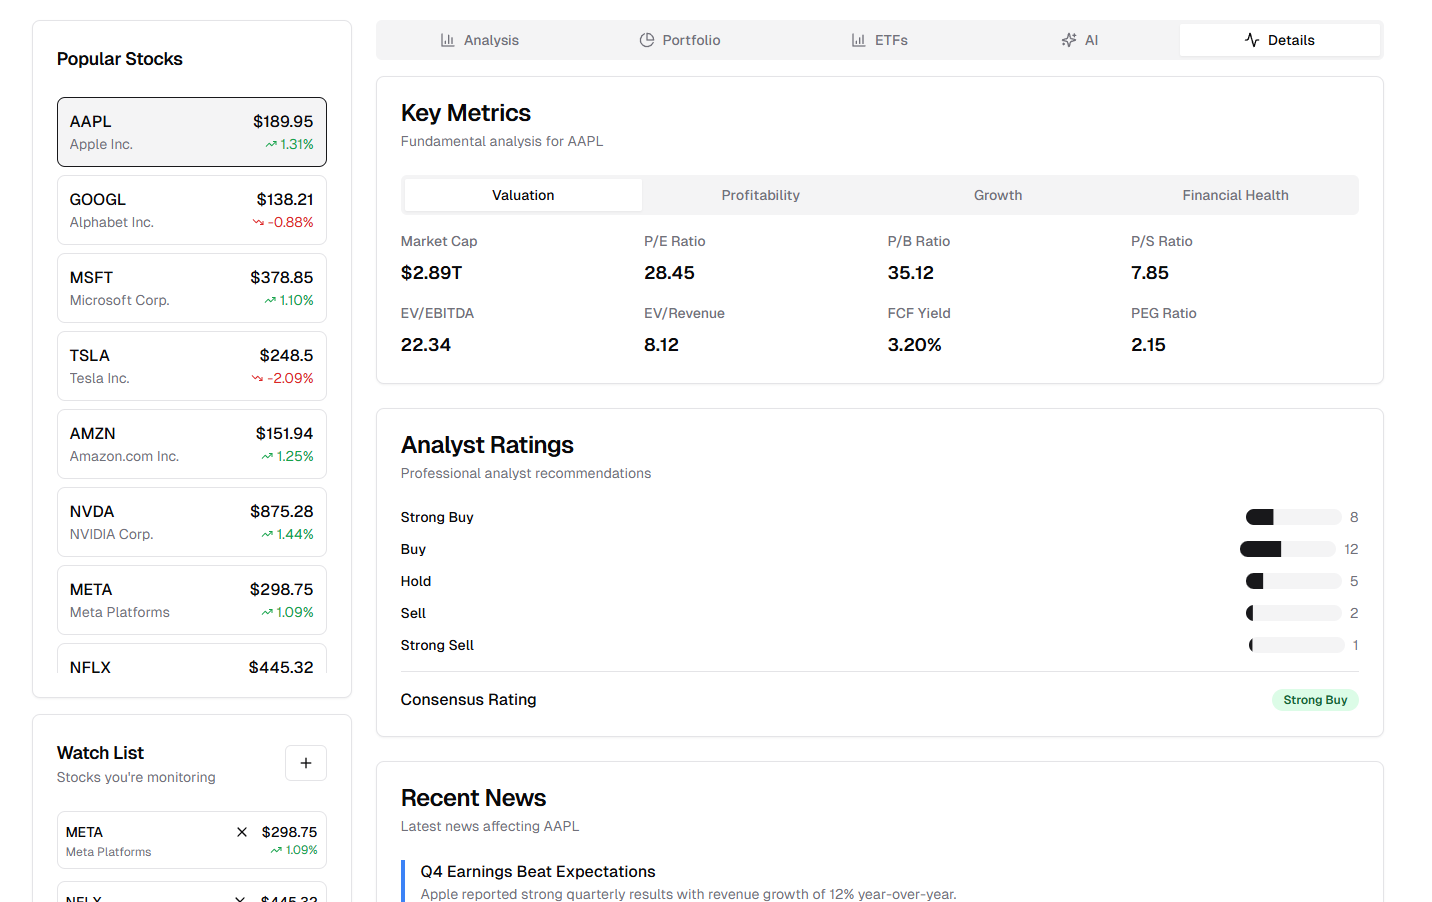
Stock Details
Detailed view of individual stock performance and metrics.
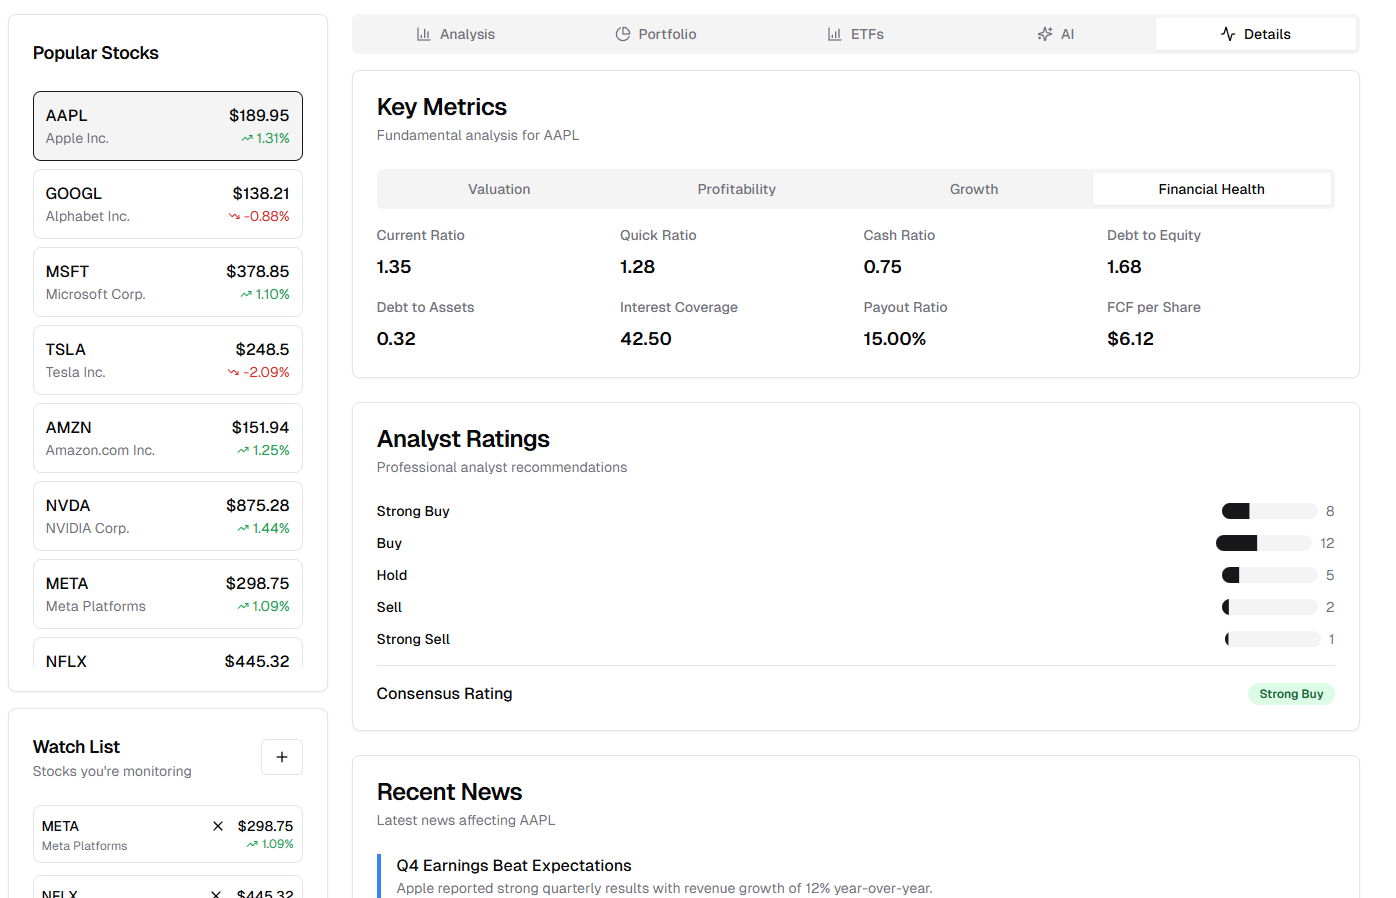
Stocks Financial Health
Visualization of financial health indicators for stocks.
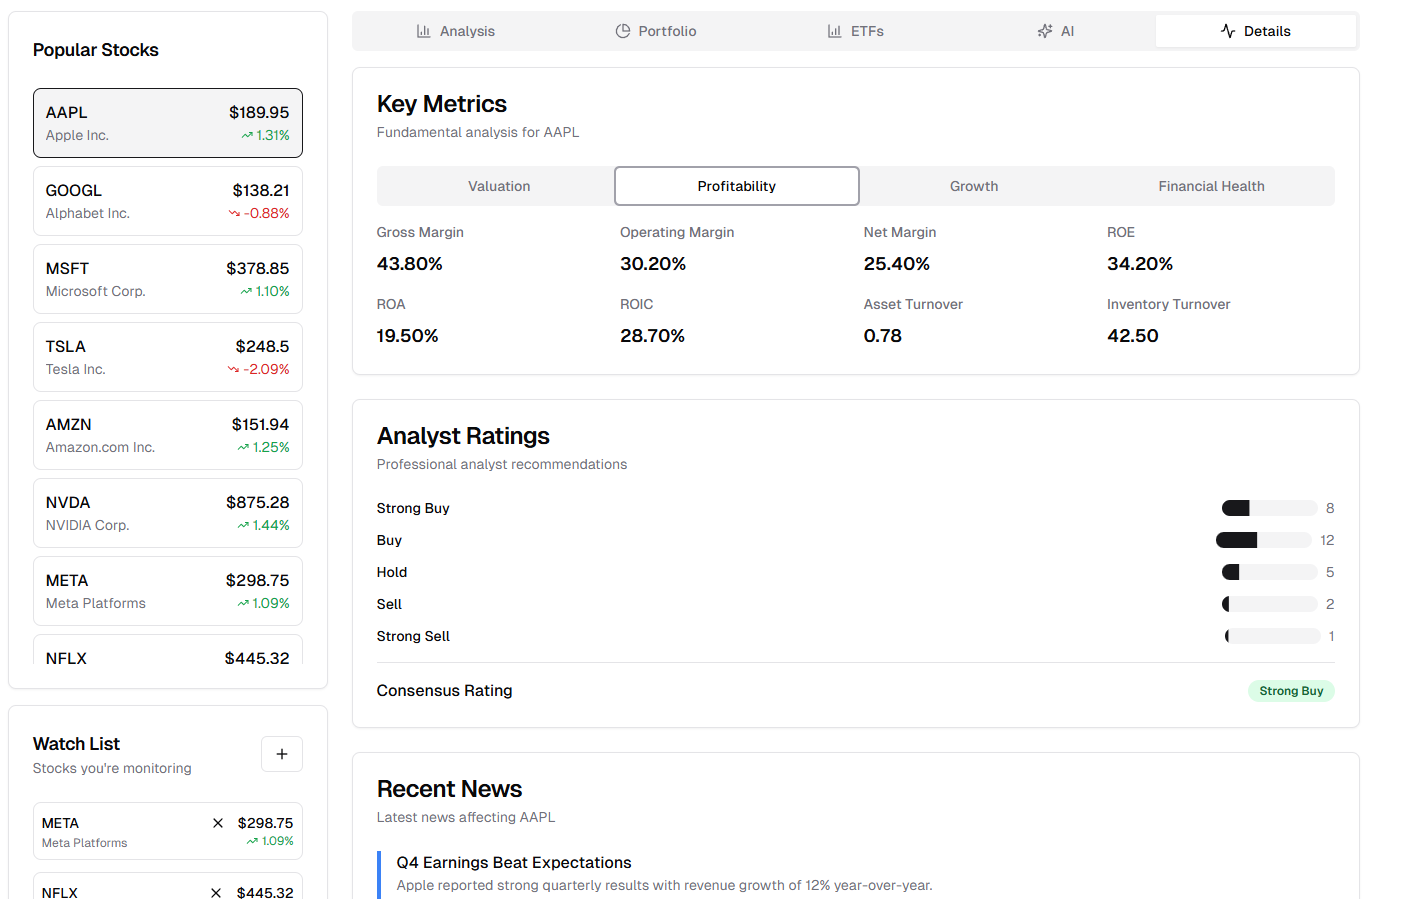
Stocks Profitability
Profitability metrics and analysis for selected stocks.
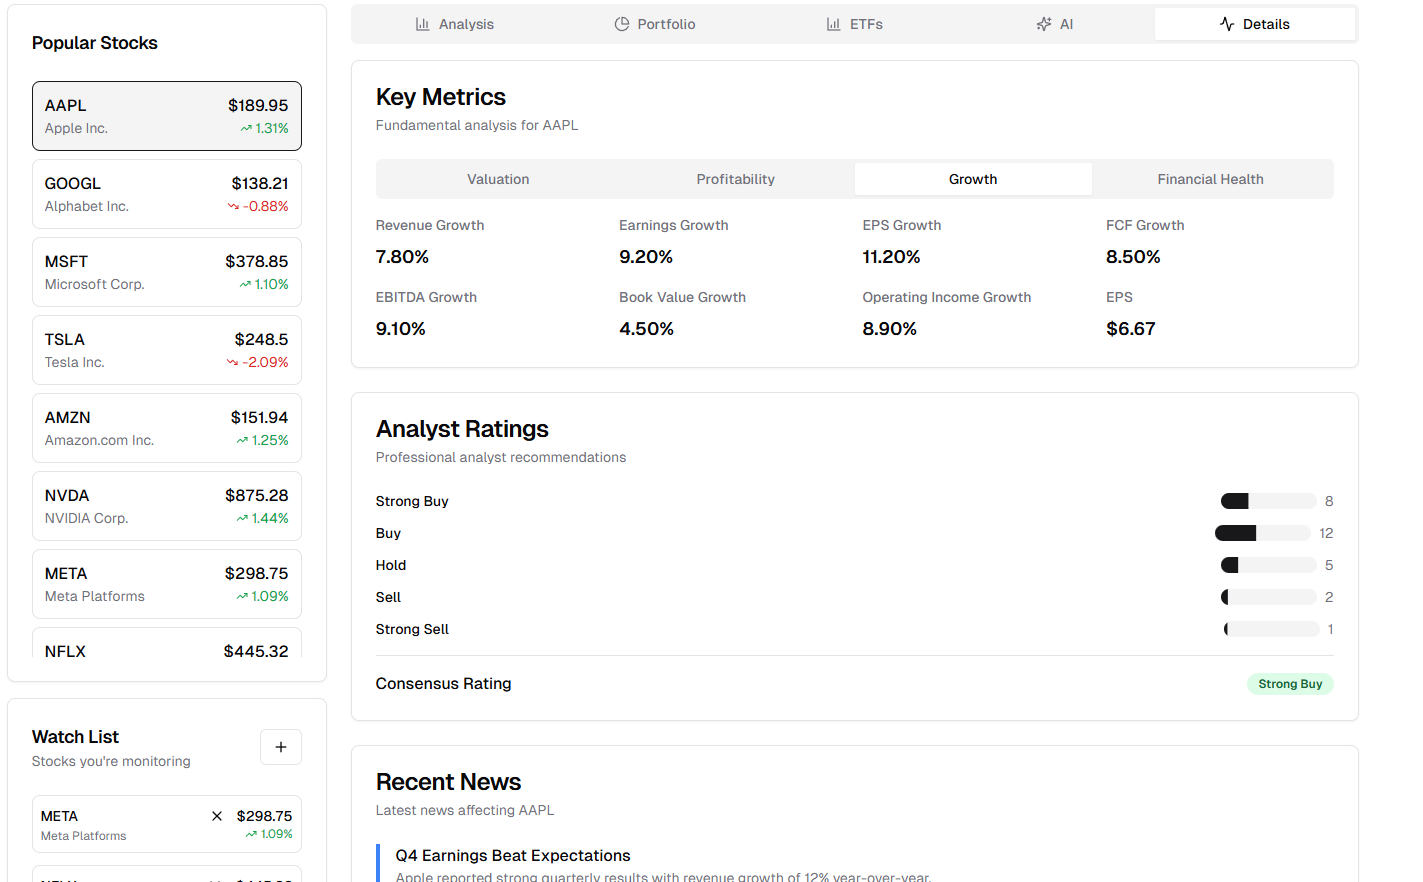
Stocks Growth
Growth indicators and trends for stocks.
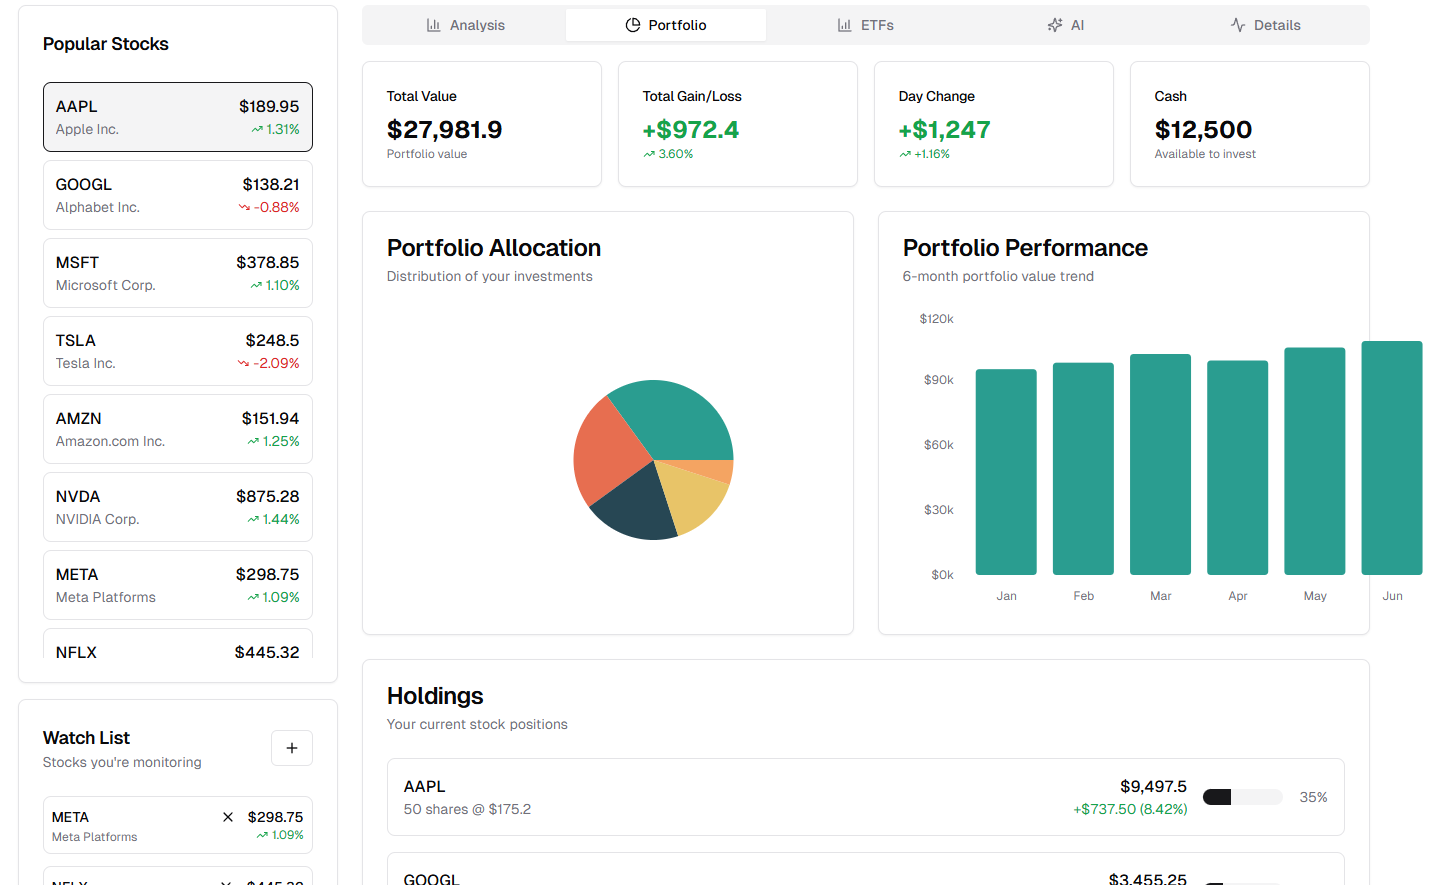
Stocks Portfolio
Portfolio management and performance summary.
Design Documentation
Results
- Delivered a scalable and responsive web application for comprehensive stock and ETF analysis.
- Enabled real-time interaction with stock data using technical and fundamental visual tools.
- Introduced AI-powered natural language insights, making stock analysis accessible to all users.
- Improved investor decision-making with clear, structured, and intelligent data visualization.
- Streamlined user experience with clean UI, toggleable technical indicators, and categorized financial tabs.
Ready to achieve similar results?
Let's discuss how we can help you overcome your business challenges and drive growth with innovative technology solutions.